Let us make confusion matrix for cross validation based results
Let us import a dataframe, first import the needed python libraries
from sklearn.metrics import confusion_matrix
from sklearn.tree import DecisionTreeClassifier
from sklearn.model_selection import cross_val_score
import numpy as np
import pandas as pd
Now import the dataframe
df = pd.read_csv('animals_classification.csv')
df
Suppose we have a data frame called df ok when we are working on jupyter notebook or Google colabs. Now split the dataframe into x(the features we feed into the machine learning model), and y(the label or target)
x_my=df.drop(['animal'], axis=1)
x_my

y_my=df['animal']
Then we train the data into a machine learning model for explanation purpose let us assume we used decision trees.
dt = DecisionTreeClassifier()
# I used 10 fold cross validation
scores = cross_val_score(dt, x_my, y_my, cv=10, scoring='accuracy')
print(scores)
print('Model accuracy score : {0:0.4f}'.format(scores.mean()))
Now let us obtain the matrix of predicted target values and the true target values originally found in the dataset.
y_pred = cross_val_predict(dt, x_my, y_my, cv=10)
conf_mat = confusion_matrix(y_my, y_pred)
print(conf_mat)
Now simply we can feed this into seaborn and get a colored confusion matrix.
import seaborn as snNew
import pandas as pdNew
import matplotlib.pyplot as plt
import matplotlib.pyplot as pltNew

ax= plt.subplot()

array=[[20,  3 , 0, 0 ],
 [ 0 ,5,  13,  0],
 [ 3 , 0 ,2,  18],
 [ 2 , 18 , 3 ,]]

confusion_matrix = pdNew.DataFrame(array, range(4), range(4))
snNew.heatmap(confusion_matrix, annot=True ,cmap="YlGn", ax=ax)

ax.set_xlabel('Predicted labels');ax.set_ylabel('True labels');
ax.xaxis.set_ticklabels(['Dog', 'Cat','Pig','Snake']); ax.yaxis.set_ticklabels(['Dog', 'Cat','Pig','Snake']);
pltNew.show()
Suppose your confusion matrix has 3 classes only, as Dog,Cat, Pig then modify the code as
array=[[a, b , c],
 [ d ,e,  f],
 [ g , h ,i]]

confusion_matrix = pdNew.DataFrame(array, range(3), range(3))
snNew.heatmap(confusion_matrix, annot=True ,cmap="YlGn", ax=ax)

ax.set_xlabel('Predicted labels');ax.set_ylabel('True labels');
ax.xaxis.set_ticklabels(['Dog', 'Cat','Pig']); ax.yaxis.set_ticklabels(['Dog', 'Cat','Pig']);
pltNew.show()
so its easy just modify the range as per the number of target classes you have, and feed in the correct array, and enter the names of target class as needed for the true target names, and predicted target names.
Now for something extra, let us plot confusion matrix in different shades of colours.

import seaborn as snNew
import pandas as pdNew
import matplotlib.pyplot as plt
import matplotlib.pyplot as pltNew

ax= plt.subplot()

array=[[20,  3 , 0, 0 ],
 [ 0 ,5,  13,  0],
 [ 3 , 0 ,2,  18],
 [ 2 , 18 , 3 ,]]

confusion_matrix = pdNew.DataFrame(array, range(4), range(4))
snNew.heatmap(confusion_matrix, annot=True ,cmap="flare", ax=ax)

ax.set_xlabel('Predicted labels');ax.set_ylabel('True labels');
ax.xaxis.set_ticklabels(['Dog', 'Cat','Pig','Snake']); ax.yaxis.set_ticklabels(['Dog', 'Cat','Pig','Snake']);
pltNew.show()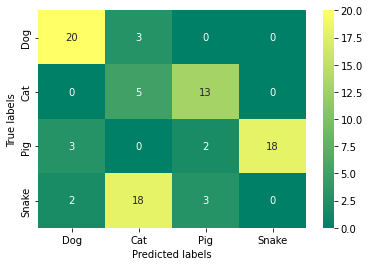
import seaborn as snNew
import pandas as pdNew
import matplotlib.pyplot as plt
import matplotlib.pyplot as pltNew

ax= plt.subplot()

array=[[20,  3 , 0, 0 ],
 [ 0 ,5,  13,  0],
 [ 3 , 0 ,2,  18],
 [ 2 , 18 , 3 ,0]]

confusion_matrix = pdNew.DataFrame(array, range(4), range(4))
snNew.heatmap(confusion_matrix, annot=True ,cmap="summer", ax=ax)

ax.set_xlabel('Predicted labels');ax.set_ylabel('True labels');
ax.xaxis.set_ticklabels(['Dog', 'Cat','Pig','Snake']); ax.yaxis.set_ticklabels(['Dog', 'Cat','Pig','Snake']);
pltNew.show()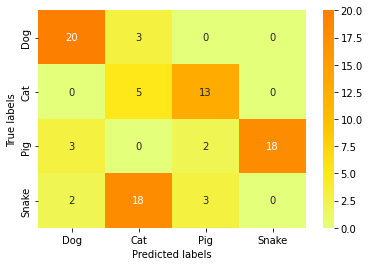
import seaborn as snNew
import pandas as pdNew
import matplotlib.pyplot as plt
import matplotlib.pyplot as pltNew

ax= plt.subplot()

array=[[20,  3 , 0, 0 ],
 [ 0 ,5,  13,  0],
 [ 3 , 0 ,2,  18],
 [ 2 , 18 , 3 ,0]]

confusion_matrix = pdNew.DataFrame(array, range(4), range(4))
snNew.heatmap(confusion_matrix, annot=True ,cmap="Wistia", ax=ax)

ax.set_xlabel('Predicted labels');ax.set_ylabel('True labels');
ax.xaxis.set_ticklabels(['Dog', 'Cat','Pig','Snake']); ax.yaxis.set_ticklabels(['Dog', 'Cat','Pig','Snake']);
pltNew.show()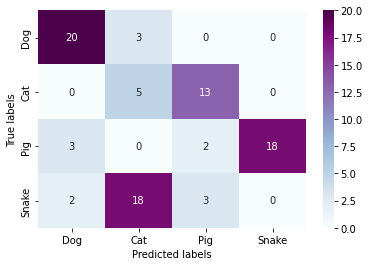
import seaborn as snNew
import pandas as pdNew
import matplotlib.pyplot as plt
import matplotlib.pyplot as pltNew

ax= plt.subplot()

array=[[20,  3 , 0, 0 ],
 [ 0 ,5,  13,  0],
 [ 3 , 0 ,2,  18],
 [ 2 , 18 , 3 ,0]]

confusion_matrix = pdNew.DataFrame(array, range(4), range(4))
snNew.heatmap(confusion_matrix, annot=True ,cmap="BuPu", ax=ax)

ax.set_xlabel('Predicted labels');ax.set_ylabel('True labels');
ax.xaxis.set_ticklabels(['Dog', 'Cat','Pig','Snake']); ax.yaxis.set_ticklabels(['Dog', 'Cat','Pig','Snake']);
pltNew.show()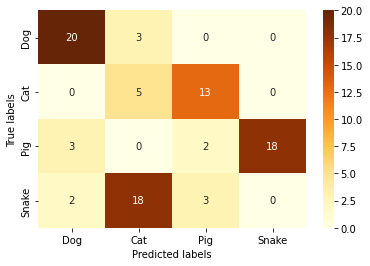
import seaborn as snNew
import pandas as pdNew
import matplotlib.pyplot as plt
import matplotlib.pyplot as pltNew

ax= plt.subplot()

array=[[20,  3 , 0, 0 ],
 [ 0 ,5,  13,  0],
 [ 3 , 0 ,2,  18],
 [ 2 , 18 , 3 ,0]]

confusion_matrix = pdNew.DataFrame(array, range(4), range(4))
snNew.heatmap(confusion_matrix, annot=True ,cmap="YlOrBr", ax=ax)

ax.set_xlabel('Predicted labels');ax.set_ylabel('True labels');
ax.xaxis.set_ticklabels(['Dog', 'Cat','Pig','Snake']); ax.yaxis.set_ticklabels(['Dog', 'Cat','Pig','Snake']);
pltNew.show()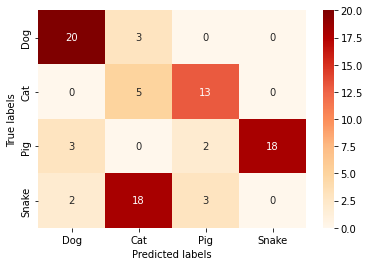
import seaborn as snNew
import pandas as pdNew
import matplotlib.pyplot as plt
import matplotlib.pyplot as pltNew

ax= plt.subplot()

array=[[20,  3 , 0, 0 ],
 [ 0 ,5,  13,  0],
 [ 3 , 0 ,2,  18],
 [ 2 , 18 , 3 ,0]]

confusion_matrix = pdNew.DataFrame(array, range(4), range(4))
snNew.heatmap(confusion_matrix, annot=True ,cmap="OrRd", ax=ax)

ax.set_xlabel('Predicted labels');ax.set_ylabel('True labels');
ax.xaxis.set_ticklabels(['Dog', 'Cat','Pig','Snake']); ax.yaxis.set_ticklabels(['Dog', 'Cat','Pig','Snake']);
pltNew.show()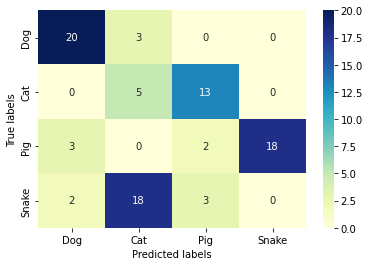
import seaborn as snNew
import pandas as pdNew
import matplotlib.pyplot as plt
import matplotlib.pyplot as pltNew

ax= plt.subplot()

array=[[20,  3 , 0, 0 ],
 [ 0 ,5,  13,  0],
 [ 3 , 0 ,2,  18],
 [ 2 , 18 , 3 ,0]]

confusion_matrix = pdNew.DataFrame(array, range(4), range(4))
snNew.heatmap(confusion_matrix, annot=True ,cmap="YlGnBu", ax=ax)

ax.set_xlabel('Predicted labels');ax.set_ylabel('True labels');
ax.xaxis.set_ticklabels(['Dog', 'Cat','Pig','Snake']); ax.yaxis.set_ticklabels(['Dog', 'Cat','Pig','Snake']);
pltNew.show()
Thanks for reading, hope this blog was useful. Have fun coding !!!
